IELTS Writing Task 1 Vocabulary: Essential Words for Charts, Graphs, and Maps
IELTS Writing Task 1 is not an essay — it is a data description. You have 20 minutes to describe a chart, graph, table, map, or process diagram in at least 150 words. The vocabulary you need is completely different from Task 2. Instead of opinions and arguments, you need words for trends, comparisons, proportions, and time periods.
Most candidates lose marks here not because they misread the data, but because they describe it using the same three words: “increased,” “decreased,” and “the chart shows.” This guide gives you 150+ words and phrases organized by exactly how you use them in Task 1 — so you can describe any chart type with the precision and range that Band 7–9 requires.
- Total vocabulary: 150+ words and phrases
- Organized by: function (trends, comparisons, proportions, chart introductions, time)
- Chart types covered: line graphs, bar charts, pie charts, tables, maps, process diagrams
- Best for: IELTS Academic Writing Task 1, Band 6–9 preparation
How Vocabulary Is Scored in Task 1
Task 1 uses the same four criteria as Task 2, each worth 25%:
| Criterion | What It Means for Task 1 |
|---|---|
| Task Achievement | Did you describe the key features and make comparisons? |
| Coherence and Cohesion | Is your description logically organized and well-linked? |
| Lexical Resource | Did you use a range of vocabulary accurately? |
| Grammatical Range | Did you use a variety of sentence structures? |
Lexical Resource is where vocabulary directly determines your score:
| Band | What Examiners Expect |
|---|---|
| 5 | Limited vocabulary; may use the wrong word for trends; repetitive |
| 6 | Adequate vocabulary; attempts less common words but with some errors |
| 7 | Sufficient range to describe data flexibly; uses less common vocabulary with awareness of style |
| 8 | Wide range of vocabulary used naturally; rare errors; precise word choice |
| 9 | Full flexibility and precision; the writing reads like a professional report |
The single biggest vocabulary mistake in Task 1 is repetition. If you write “increased” four times and “decreased” three times, you are capped at Band 6 regardless of how accurate your data description is.
Category 1: Introducing the Chart
Every Task 1 answer starts by paraphrasing what the chart shows. Never copy the question word-for-word — examiners penalize this.
Verbs for “The chart shows…”
| Verb | Formality | Example |
|---|---|---|
| illustrates | formal | The line graph illustrates changes in unemployment rates over a 20-year period. |
| depicts | formal | The bar chart depicts the number of tourists visiting five countries in 2024. |
| presents | neutral | The table presents a comparison of average salaries across four industries. |
| compares | neutral | The chart compares the percentage of households with internet access in three nations. |
| outlines | formal | The diagram outlines the process of water purification. |
| provides information about | neutral | The graph provides information about energy consumption by sector. |
| gives a breakdown of | neutral | The pie chart gives a breakdown of government spending by category. |
Nouns for Chart Types
Use precise nouns — do not call everything “the chart.”
| Chart Type | Noun Phrases |
|---|---|
| Line graph | the line graph, the graph, the figure |
| Bar chart | the bar chart, the chart, the figure |
| Pie chart | the pie chart, the chart |
| Table | the table, the data, the figures |
| Map | the two maps, the diagrams |
| Process | the diagram, the flow chart, the figure |
Time Expressions for the Introduction
| Expression | Example |
|---|---|
| over a _-year period | …over a 30-year period from 1990 to 2020. |
| between and | …between 2010 and 2025. |
| from to | …from January to December 2024. |
| during the period | …during the period shown. |
| in the year _ | …in the year 2023. |
Example introduction (Band 7+): The line graph illustrates the average monthly rainfall in three Asian cities over a 12-month period from January to December.
Category 2: Describing Upward Trends
This is the most important vocabulary category for Task 1. You need multiple ways to say “went up.”
Verbs (Upward Movement)
| Verb | Strength | Example |
|---|---|---|
| rose | moderate | Sales rose from 200 to 350 units. |
| increased | moderate | The number of students increased steadily. |
| grew | moderate | The population grew by 15% over the decade. |
| climbed | moderate–strong | Unemployment climbed to 8% in the third quarter. |
| surged | strong | Demand surged during the holiday season. |
| soared | very strong | House prices soared to record levels. |
| rocketed | very strong | Internet usage rocketed between 2000 and 2010. |
| jumped | sudden | Exports jumped by 25% in a single month. |
| doubled | specific | The figure doubled from 500 to 1,000. |
| tripled | specific | Revenue tripled in the space of five years. |
Nouns (Upward Movement)
| Noun | Strength | Example |
|---|---|---|
| a rise | moderate | There was a rise in the number of applicants. |
| an increase | moderate | The chart shows an increase of 20%. |
| growth | moderate | The country experienced steady economic growth. |
| a surge | strong | There was a sharp surge in demand. |
| a jump | sudden | A sudden jump occurred in March. |
| a peak | maximum | The figure reached a peak of 450 in July. |
Adverbs and Adjectives (Speed and Size)
| Describing Speed/Size | Adverb (with verb) | Adjective (with noun) |
|---|---|---|
| small change | slightly, marginally | a slight, a marginal |
| moderate change | moderately, steadily | a moderate, a steady |
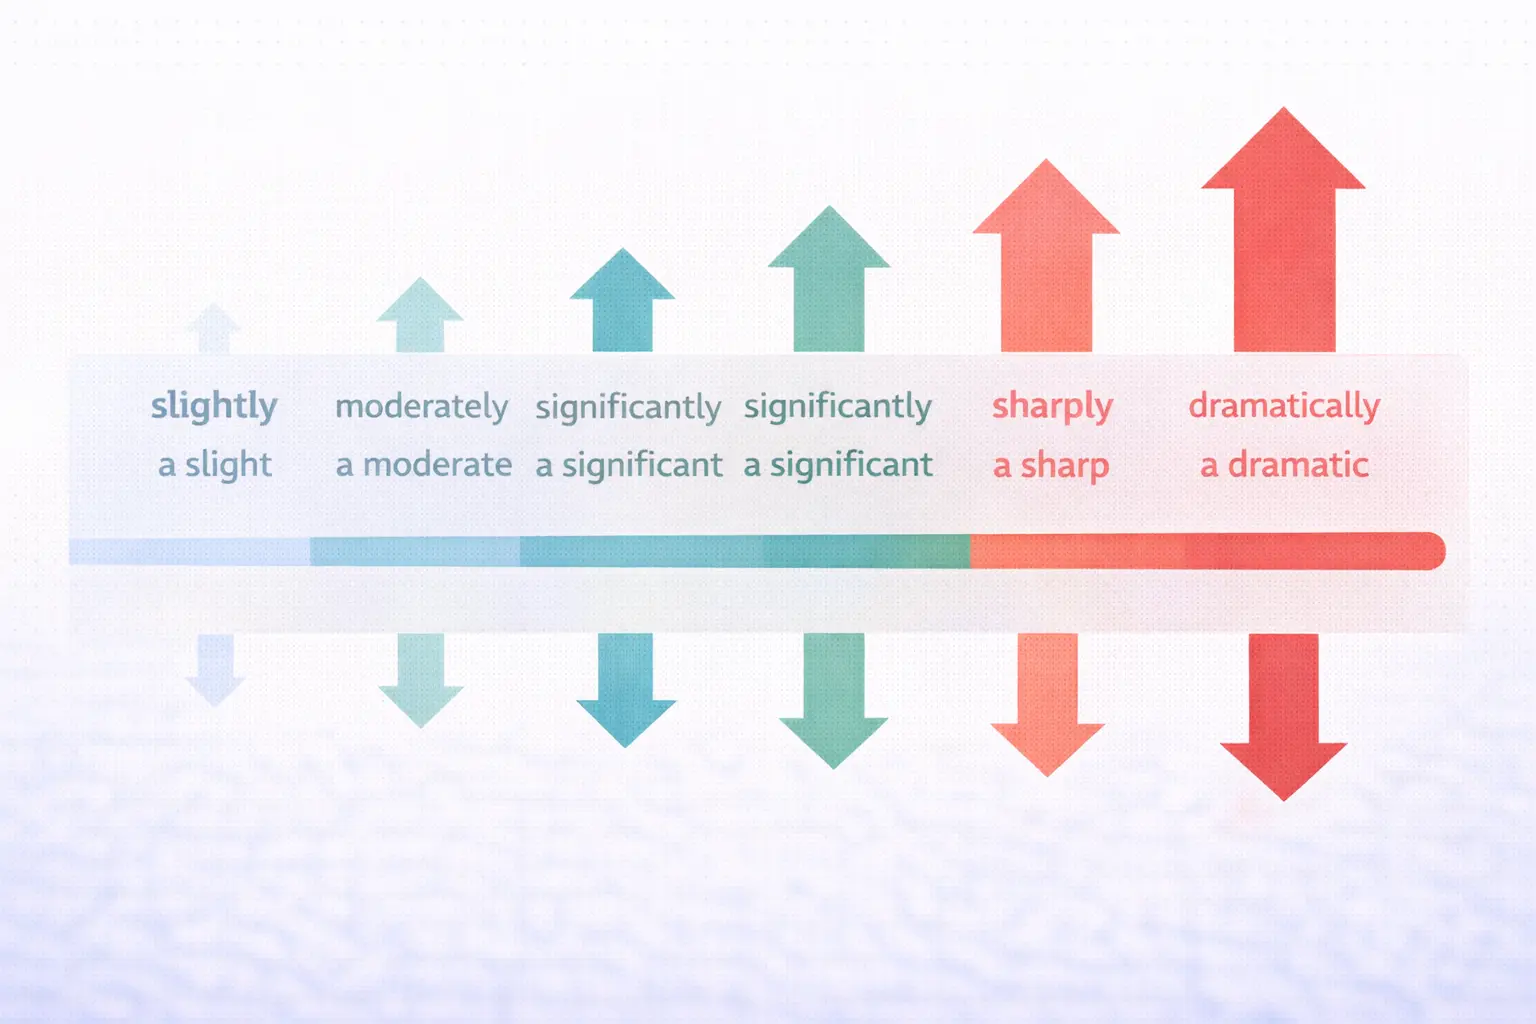
| large change | significantly, considerably | a significant, a considerable |
| fast change | sharply, rapidly, dramatically | a sharp, a rapid, a dramatic |
| very fast change | steeply, exponentially | a steep, an exponential |
Combining them:
- Sales rose sharply from 200 to 500. (verb + adverb)
- There was a sharp rise from 200 to 500. (adjective + noun)
- The figure increased significantly, reaching 500 by December. (verb + adverb)
Category 3: Describing Downward Trends
Verbs (Downward Movement)
| Verb | Strength | Example |
|---|---|---|
| fell | moderate | The temperature fell to below zero overnight. |
| decreased | moderate | Exports decreased by 12% compared to the previous year. |
| declined | moderate | The birth rate has declined steadily since 2010. |
| dropped | moderate–strong | Attendance dropped sharply in the second quarter. |
| shrank | moderate | The workforce shrank due to automation. |
| plummeted | very strong | Tourism numbers plummeted during the pandemic. |
| plunged | very strong | Share prices plunged after the announcement. |
| halved | specific | The number of complaints halved within one year. |
| dipped | slight/temporary | Revenue dipped briefly in March before recovering. |
Nouns (Downward Movement)
| Noun | Strength | Example |
|---|---|---|
| a fall | moderate | There was a fall of 15% in the third quarter. |
| a decrease | moderate | The data shows a decrease in household spending. |
| a decline | moderate | A steady decline is visible from 2015 onwards. |
| a drop | moderate–strong | A sharp drop occurred between June and July. |
| a dip | slight/temporary | There was a slight dip in sales during the summer. |
| a low | minimum | The figure reached a low of 120 in February. |
The same adverbs and adjectives from Category 2 apply here: fell sharply, a dramatic decline, decreased slightly.
Category 4: Describing Stability and Fluctuation
Not all data goes up or down. You need vocabulary for flat lines and unstable movement.
Stability (No Change)
| Expression | Example |
|---|---|
| remained stable at | The rate remained stable at approximately 5%. |
| stayed constant at | Prices stayed constant at $200 throughout the year. |
| leveled off at | After rising sharply, the figure leveled off at 300. |
| plateaued at | Growth plateaued at 3% between 2018 and 2022. |
| remained unchanged | The proportion of female employees remained unchanged. |
| held steady at | Interest rates held steady at 2.5%. |
| maintained the same level | Exports maintained the same level as the previous year. |
Fluctuation (Up and Down)
| Expression | Example |
|---|---|
| fluctuated between and | The exchange rate fluctuated between 1.2 and 1.5. |
| varied considerably | Rainfall varied considerably from month to month. |
| experienced fluctuations | The stock price experienced significant fluctuations. |
| was erratic / volatile | Sales figures were erratic throughout the period. |
Category 5: Comparing Data
Task 1 almost always requires comparisons — between countries, time periods, categories, or groups.
Comparing Higher Values
| Expression | Example |
|---|---|
| was higher than | Spending on education was higher than spending on defense. |
| exceeded | Exports exceeded imports for the first time in 2019. |
| was the highest | Japan had the highest internet usage rate at 92%. |
| surpassed | Renewable energy surpassed coal as the primary source. |
| outnumbered | Female graduates outnumbered male graduates by 2 to 1. |
| accounted for the largest share | Housing accounted for the largest share of expenditure. |
Comparing Lower Values
| Expression | Example |
|---|---|
| was lower than | The average salary was lower than the national median. |
| was the lowest | Country C had the lowest GDP per capita. |
| fell behind | Rural areas fell behind urban areas in internet access. |
| accounted for the smallest proportion | Transport accounted for the smallest proportion of spending. |
Comparing Similar Values
| Expression | Example |
|---|---|
| was similar to | Male and female participation rates were similar. |
| was comparable to | The 2020 figure was comparable to that of 2015. |
| was almost the same as | Spending on food was almost the same as spending on transport. |
| was roughly equal to | The number of imports was roughly equal to exports. |
Contrast Phrases
| Expression | Example |
|---|---|
| whereas | Japan had a rate of 92%, whereas India had only 34%. |
| while | While exports rose, imports declined sharply. |
| in contrast | Spending on education grew. In contrast, defense spending fell. |
| compared to / compared with | The figure was 45% in 2020, compared to only 12% in 2000. |
| by contrast | Urban areas grew rapidly. By contrast, rural populations shrank. |
| on the other hand | Europe saw growth. On the other hand, Africa experienced a decline. |
Category 6: Describing Proportions and Quantities
Essential for pie charts and tables.
| Expression | Approximate Range | Example |
|---|---|---|
| the vast majority of | 80–95% | The vast majority of respondents preferred option A. |
| the majority of | 50–80% | The majority of students chose science subjects. |
| over half / more than half | 50–65% | Over half of the budget was allocated to salaries. |
| a significant proportion of | 30–50% | A significant proportion of energy came from coal. |
| around a third / roughly a third | ~33% | Roughly a third of the population lived in urban areas. |
| a quarter / approximately a quarter | ~25% | A quarter of all exports went to China. |
| a small minority of | 5–15% | A small minority of households had no internet access. |
| a negligible proportion of | <5% | A negligible proportion of energy came from solar power. |
Approximation Words
| Word | Example |
|---|---|
| approximately / roughly | Approximately 45% of students passed. |
| around / about | Around 30 million tourists visited annually. |
| just over / just under | Just over 60% of respondents agreed. |
| nearly / almost | Nearly 90% of households had internet access. |
| exactly / precisely | The figure was exactly 50%. |
Category 7: Vocabulary for Maps and Process Diagrams
Maps and processes require different vocabulary from data charts. Many candidates lose marks because they apply graph vocabulary to these question types.
Maps — Describing Changes
| Expression | Example |
|---|---|
| was replaced by | The farmland was replaced by a shopping center. |
| was converted into | The warehouse was converted into apartments. |
| was demolished / was knocked down | The old factory was demolished to make way for a park. |
| was constructed / was built | A new bridge was constructed across the river. |
| was extended / was expanded | The road was extended to connect the two villages. |
| was relocated to | The hospital was relocated to the outskirts of town. |
| remained unchanged | The church in the center remained unchanged. |
| underwent significant development | The area to the east underwent significant development. |
Maps — Describing Location
| Expression | Example |
|---|---|
| to the north / south / east / west of | A park was built to the north of the river. |
| in the center of | The town hall is located in the center of the map. |
| adjacent to / next to | The new school was built adjacent to the library. |
| on the outskirts of | A new housing estate was developed on the outskirts. |
| along the coast / riverbank | Hotels were constructed along the coast. |
| in the northeast / southwest corner | A factory appeared in the northeast corner. |
Process Diagrams — Sequencing
| Expression | Example |
|---|---|
| in the first stage / step | In the first stage, raw materials are collected. |
| then / next / subsequently | The mixture is then heated to 100°C. |
| following this / after this | Following this, the liquid is filtered. |
| at this point / at this stage | At this stage, quality checks are performed. |
| finally / in the final stage | Finally, the finished product is packaged for distribution. |
| the process begins with | The process begins with the extraction of raw materials. |
| once _ is complete | Once filtration is complete, the water enters the storage tank. |
Before and After: Full Task 1 Response
The Question
The line graph below shows the percentage of households with internet access in three countries between 2000 and 2020.
Band 5 Version
The chart shows the percentage of households with internet access in three countries between 2000 and 2020. In 2000, Japan had 30%, the USA had 40%, and India had 5%. The internet access increased in all three countries. Japan increased to 95%, the USA increased to 90%, and India increased to 50%. Japan had the highest percentage in 2020. India had the lowest percentage. The internet access increased a lot in all countries.
Problems: “increased” used 4 times, “shows” copied from the question, “a lot” is vague, no comparison language, no adverbs.
Band 7+ Version
The line graph illustrates the proportion of households with internet connectivity in Japan, the USA, and India over a two-decade period from 2000 to 2020.
Overall, internet access rose significantly in all three nations, with Japan achieving the highest penetration rate by the end of the period.
In 2000, the USA led with approximately 40% of households connected, followed by Japan at 30%, while India lagged considerably behind at just 5%. Over the next decade, Japan experienced the most dramatic growth, surging from 30% to around 80%, thereby surpassing the USA, which climbed more steadily to 75%.
Between 2010 and 2020, Japan’s figure continued to rise, reaching a peak of 95%. The USA followed a similar trajectory, plateauing at roughly 90% by 2018. India, although starting from a much lower base, saw the steepest proportional increase, rising from 15% in 2010 to 50% by 2020 — a more than threefold increase in a single decade.
What changed:
- “shows” → “illustrates”
- “percentage” → “proportion”
- “countries” → “nations”
- “increased” (×4) → “rose,” “surging,” “climbed,” “continued to rise”
- Added strength adverbs: “significantly,” “dramatically,” “steadily,” “considerably”
- Added comparison language: “surpassing,” “followed a similar trajectory,” “lagged behind”
- Added approximation: “approximately,” “roughly,” “around”
- Added an overall statement summarizing the main trend
Vocabulary to Practice
Save these high-impact Task 1 words to your Linglify dictionary. Click any word to see its full definition and pronunciation.
valid
adjective
Having legal or official force; acceptable.
Examples
- Valid argument supports logical reasoning and conclusion.
- Valid passport allows international travel without problems.
flexible
adjective
Able to change or bend without breaking; adaptable.
Examples
- Flexible working arrangements help employees balance work and family life.
- The flexible plastic tube can bend without breaking or cracking.
transmit
verb
To send or pass on information, signals, or messages.
Examples
- Disease may transmit through contact with surfaces.
- Satellites transmit signals across vast distances effectively.
executive
adjective
Relating to people in high positions of management or authority.
Examples
- Executive decisions require careful consideration of multiple factors and consequences.
- The executive branch of government is responsible for implementing laws.
finance
verb
This verb means to provide money for a project or activity, or to manage financial matters.
Examples
- Many students need loans to finance their college education expenses.
- The bank agreed to finance the construction of the new shopping center.
culmination
noun
The highest point or final stage of a process or event.
Examples
- The graduation ceremony was the culmination of four years of hard study.
- Winning the championship represented the culmination of the team's efforts.
gulp
verb
This verb means to swallow quickly or in large amounts, often with a gulping sound.
Examples
- She had to gulp nervously before giving her presentation to the board.
- The thirsty runner gulped down an entire bottle of cold water.
tribe
noun
A group of people who share a common culture, language, or history.
Examples
- Ancient tribe lived in harmony with nature.
- Indigenous tribe preserves traditional customs and languages.
cherished
adjective
Deeply loved or valued; treasured.
Examples
- His cherished dream of becoming a pilot finally came true.
- The old photograph was her most cherished possession from childhood.
fate
noun
The power or force that is believed to determine what happens in the future.
Examples
- She believes that fate brought them together at the right moment.
- The explorer's fate remained unknown after he disappeared in the jungle.
territory
noun
An area of land with defined borders, often controlled by a country.
Examples
- Animal territory provides food and shelter resources.
- National territory requires protection from foreign invasion.
payable
adjective
Able to be paid; due for payment.
Examples
- All dues are payable at the end of the month.
- The invoice is payable within 30 days.
serenity
noun
A state of calm, peacefulness, and mental clarity.
Examples
- She maintained her serenity despite the chaos.
- The serenity of the lake was calming.
classy
adjective
This adjective describes someone or something that is stylish, elegant, or of high quality.
Examples
- Classy restaurant serves gourmet food in elegant dining atmosphere.
- Her classy appearance impressed everyone at formal business meeting.
revolt
verb
To openly oppose or fight against authority, rules, or established order.
Examples
- A revolt broke out in the city center last night.
- The workers decided to revolt against the unfair conditions.
rethink
verb
To reconsider or think about something again, often leading to a new decision or opinion.
Examples
- He decided to rethink his position on the issue.
- We need to rethink our strategy for the project.
gypsy
noun
A member of a traditionally nomadic ethnic group known for their itinerant lifestyle and distinct culture.
Examples
- Traditional gypsy music features violin and passionate vocals.
- Wandering gypsy caravan traveled through European countryside.
buffoon
noun
A person who acts in a silly or foolish way, often to entertain others.
Examples
- Court buffoon entertained royal family with silly performances.
- Don't act like buffoon during important business presentation.
execution
noun
The act of carrying out a plan or law; the process of killing or executing.
Examples
- Perfect execution of the dance routine impressed judges and audience members.
- The execution of the business plan requires careful coordination and timing.
spellbound
adjective
Fascinated or captivated by something.
Examples
- Audience sits spellbound during magical performance tonight.
- Children remain spellbound by storyteller's fascinating tales.
pet
adjective
Relating to a domesticated animal kept for companionship or amusement.
Examples
- Pet project receives extra attention and resources.
- Pet theory explains professor's research focus area.
master
noun
A person who has control or authority over something or someone, often skilled in a particular area.
Examples
- Apprentices learn traditional crafts from experienced master craftsmen.
- The chess master defeated opponents using brilliant strategic moves.
salvage
noun
The act of saving or rescuing something from loss or destruction.
Examples
- Antique dealer specializes in salvage from demolished buildings.
- Divers recovered valuable salvage from sunken merchant ship.
Practice Strategy for Task 1 Vocabulary
1. Describe one chart per day. Find IELTS practice charts online (Cambridge, British Council, IDP) and write a 150-word description. Focus on using a different trend verb every time you describe a change.
2. Build synonym chains for key concepts. Write these five chains on a card and review them daily:
- went up: rose, increased, grew, climbed, surged, soared, rocketed
- went down: fell, decreased, declined, dropped, plummeted, dipped
- stayed the same: remained stable, held steady, leveled off, plateaued
- the chart shows: illustrates, depicts, presents, compares, outlines
- approximately: roughly, around, about, nearly, just over/under
3. Practice the noun + adjective form. For every trend verb you use, rewrite the same sentence using the noun form: “Sales rose sharply“ → “There was a sharp rise in sales.” This doubles your vocabulary range instantly.
4. Time yourself. In the real exam, you have 20 minutes for Task 1. Practice writing under time pressure — vocabulary recall under stress is different from relaxed study.
For a complete vocabulary learning system, read our guide on how to improve your vocabulary.
What to Do Next
-
Build your IELTS vocabulary bank. Add Task 1 words to your Linglify dictionary:
-
Learn Task 2 vocabulary next. Writing Task 1 and Task 2 require different word sets. Read our IELTS Writing Task 2 vocabulary guide for opinion, contrast, and academic vocabulary.
-
Master paraphrasing. The introduction paragraph requires paraphrasing the question. Our Synonyms for IELTS guide covers 200+ synonyms organized by the words candidates overuse most.
-
Read the complete IELTS guide. For vocabulary across all four sections — Writing, Speaking, Reading, and Listening — see The Complete IELTS Vocabulary Guide.
-
Improve your overall vocabulary. A wider general vocabulary makes Task 1 descriptions more natural. Read our guide on how to learn English vocabulary for a step-by-step system.
FAQ
What vocabulary is most important for IELTS Writing Task 1?
Trend vocabulary — words for describing increases, decreases, stability, and fluctuations. These make up 60–70% of what you write in a Task 1 answer. After that, comparison vocabulary (whereas, in contrast, surpassed) and approximation words (approximately, roughly, nearly) are the next most important categories.
How many words should I write for Task 1?
The minimum is 150 words, but most Band 7+ answers are 170–190 words. Writing significantly more than 200 words is risky — it takes time away from Task 2, which is worth twice as many marks. Focus on quality and precision, not length.
Should I include every number from the chart?
No. Select the most significant data points: the highest, lowest, starting, and ending values, plus any notable turning points. Examiners reward your ability to identify key features, not your ability to list every number.
What is the “overview” paragraph and why does it matter?
The overview is a 1–2 sentence summary of the main trends or features — written after the introduction and before the details. It is essential for Band 7+. Without an overview, you cannot score above Band 6 in Task Achievement. Example: “Overall, internet access rose significantly in all three nations, with Japan achieving the highest penetration rate.”
Is Task 1 vocabulary different from Task 2?
Yes, significantly. Task 1 needs data description vocabulary (trends, proportions, comparisons), while Task 2 needs opinion and argument vocabulary (contend, advocate, consequently). Some words overlap (e.g., “significant,” “illustrate”), but the core vocabulary sets are different. Learn both — our Task 2 vocabulary guide covers the essay-specific words.
How do I describe a pie chart differently from a line graph?
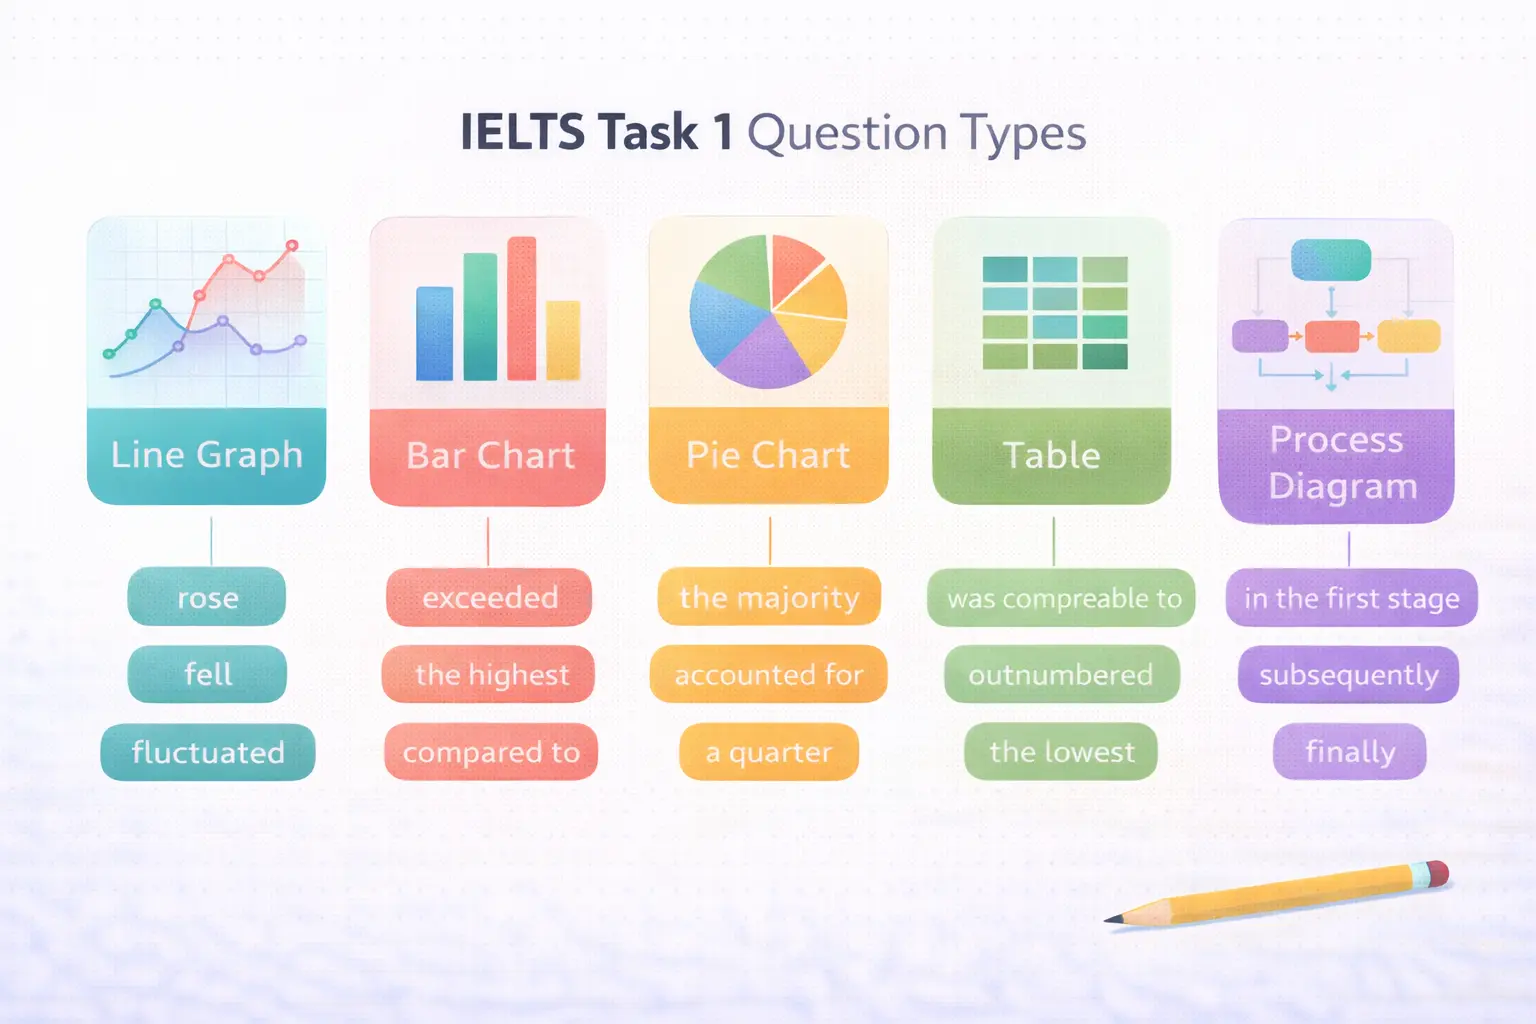
Pie charts require proportion and percentage vocabulary: “accounted for,” “comprised,” “the majority of,” “a quarter.” Line graphs require trend vocabulary: “rose,” “fell,” “fluctuated,” “peaked.” Tables need comparison vocabulary: “the highest,” “exceeded,” “was comparable to.” Matching your vocabulary to the chart type is a mark of Band 7+ writing.